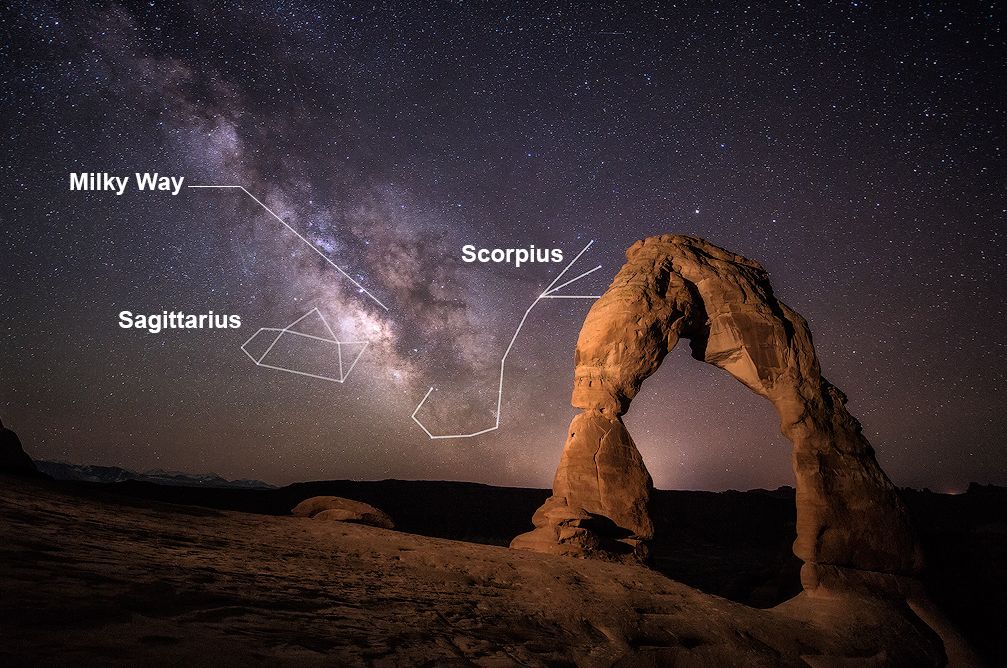
PS: to the right, a picture of the Milky Way and Sagittarius-A as seen in the Northern Hemisphere
One aspect which I believe is not very well understood by most EME practitioners and have been myself very interested into better understanding is the nature, behavior and influence of the Sky Noise on the EME conditions.
I am not an expert in radioastronomy and do not know the algorythms employed by WSJT in order to calculate the famous "TSky". In order to shed some light on the matter and better understand the "mechanic" behind this phenomenon, I decided to use an emperical approach and carry out a series of experiments.
HOW THIS ALL STARTED...
A few weeks ago, I was interested to quantify how the local noise was fluctuating in my environment so I decided to park the antenna at a random position (140AZ/45EL) and using the "Measure Mode" in WSJT, let the software collect noise measurements overnight and during a portion of the following day.
The next day, when I extracted and plotted the data in EXCEL, I was shocked by what I obtained. I was expecting to see some kind of random noise fluctuations over the many hours that the experiment ran. Instead, what I got were very well defined peaks and curves which intrigued me in a very profound way. The plot of what I obtained is shown to the right below.
ANALYSIS OF THE INITIAL DATA OBTAINED
Before going further, let's explain a little bit how this plot is constructed. The data points in blue are the many tens of thousands of noise measurements over time expressed in dB. In the "measure" mode, WSJT takes a measurement every second and that is what is represented in the plot (3600 data points every hour). The vertical axis to the left shows the relative noise scale in dB. The X-axis at the bottom represents the time when the data was collected. I will explain the rest of the graph a bit later...
Looking at this initial plot, I was struck by the two major peaks/curves, one of which was very spread out and present throughout the entire time of the experiment, and one peak that was much sharper at around 10am.
After investigating what could have cause these peaks during this specific time period, I quickly found that the wide spread out peak corresponded exactly to the rise, peak and setting of Sagittarius-A, which is known as an extremely intense source of EME noise at 144 MHZ which is located in the very core of the Milky Way and is responsible for producing the highest EME degrade period every Moon cycle. After investestigating the sharper peak located on the right shoulder of the plot, it was easy to associated this one with the passage of the Sun right in front of the main antenna lobe. This made some sense, but the shape of the peaks was posing a problem to me...
The sun passing in front of the main antenna lobe and associated increase in the noise level for a short period of time (sharp peak) made total sense considering the directivity of my antenna array, which is a 2X13 RPOL LFA. However, what I could not explain was the wide spread out peak which did not seem to repond to my antenna directivity at all and seemed to be homogeneously present throughout the entire duration of the experiment regardless of the antennas radiation pattern. In other words, since my antennas were pointing towards 140AZ/45EL, I would have expected that the noise level would have increased dramatically as Sagittarius-A was passing right in front of the main antenna lobe, that is at 145AZ/45EL. That is not what we see at all on the plot. It seemed like Sagittarius-A was not behaving like a "discrete" noise source, but as if the noise was diffused throughout the entire sky. To the contrary, the Sun was behaving like a discrete noise source as it should be. It was quite remarkable to me that I was able to capture both phenomena during the same experiment.
In order to have a better view of the Sagittarius-A pass, I also plotted its elevation on the same graph (red markers). The secondary vertical axis to the right provides the detailed scale in degrees of its elevation. The intensity of the noise increase as Sagittarius-A presence intensifies in the sky is quite dramatic and extreme.
EXPERIMENT REPEATED
The puzzling and very interesting initial results prompted me to experiment further in the following days. This time, I purposely positioned the antennas in the direction closer to where Sagittarius-A would be "peaking", which is around 180AZ and 27EL. Since there are physical limitations elevation-wise in my backyard, I chose to position the antenna array at 180AZ and 35EL, which was close enough to the target.
The results obtained are plotted to the right. Since the distance between Sagittarius-A and the Sun was much greater on that day, we do not see a sharp second peak like it is observed in the initial experiment.
Once again, the passage of Sagittarius-A and the Milky Way, which it is embeded into, produced a very nice and well-defined bell-shaped curve. It is amazing to see how much noise their presence generates, that is in the order of 8dB! Note that the data was normalized after the fact where the "0 dB" was attributed to the lowest noise level measured throughout the experiment.
As observed in the initial experiment, the noise measured did not seem to be much dependent on the antenna array directivity, otherwise the peak would be much sharper and we would see lobes, etc. The noise really seemed to be diffused and filling the entire Sky.
After investigating and putting more thoughts in the matter, the data made more sense where as shown in the picture on top of this web page, the Milky Way is more like a "Band", and not a like a single point in the Sky.
VALIDATION OF THE NON-LOCAL NATURE OF THE NOISE
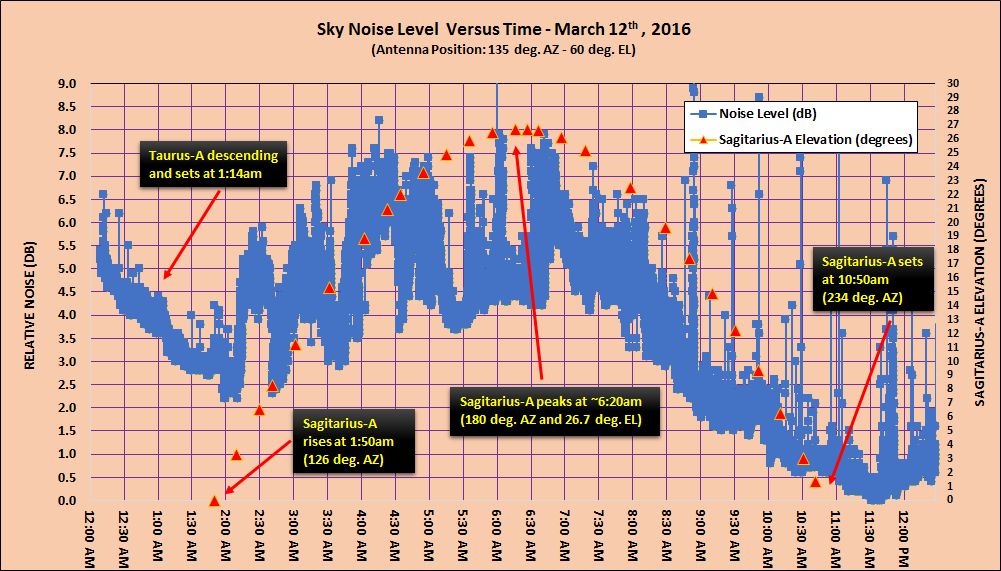
In order to validate the "diffuse" nature of the noise generated by the Milky Way and Sagittarius-A, I conducted a separate experiment where I pointed the antenna array in a direction which was totally NOT in their path. Let's remind the reader that Sagittarius-A rise at about 125AZ, peaks at 180AZ/27EL, and sets at 235AZ. For this experiment, I chose to position the array at 135AZ/60EL, which is a position very high in the sky elevation-wise and an azimuth which is also quite far away from the azimuthal positions that are involved during the passage of the Milky Way and Sagittarius-A.
The results obtained were conclusive as shown in the plot to the right. Although less well defined, the "average" shape of the curve is fairly well preserved and is completely driven by the passage of the Milky Way. The difference between the minimum and maximum noise measured remained in the order of 7.5dB, which matches the figures obtained in the previous experiment.
In this experiment, it was also interesting to observe on the far left side of the plot that the noise level was going from high to low, which corresponded exactly with Taurus-A descending and setting at 1:14am. It is not clear however if Taurus-A was really responsible for this.
It is important to note here that Sagittarius-A and the Milky Way which contains it are not the only sources of noise so there are is a complex matrix of noise generators in the Sky at any given time. However since these are some of the most significant players, it is important to pay closely attention to these at 144 MHZ.
OLD VIDEO MONTAGE SHOWING A SIMILAR PHENOMENON
Several month ago, I ran a similar experiment where the Sun, Moon AND the Milky Way were almost perfectly aligned. I had positioned the antenna array AHEAD in a direction where these noise generators would pass and measured the noise level over several hours. As the Sun and the Milky Way were aligned, the noise level increase was unbelievably extreme. Watch the video to the right to see what happened...
WHAT DOES THIS ALL MEAN?
Practically speaking, the implications of the phenomena described in this section are extremely significant. Let me explain... The famous "Sky Temperature" (Tsky) shown in WSJT and related degrade factor (DGR) typically do not change much during a typical Moon Pass. HOWEVER, as demonstrated in the plots above, regardless of the antenna direction or the Moon position, the passage of the Milky Way in the Sky seems to dictate the Sky noise level AND THAT NOISE LEVEL CHANGES DRASTICALLY WITH THE PASSAGE OF THE MILKY WAY IN THE SKY, it is not constant at all.
For instance, let's imagine that the Moon is "trailing" the Milky Way in the Sky by about 5 hours, if an EME practitioner schedules a Sked while the Milky Way is still high up in the Sky, the results of the experiment above suggest that the noise level will be MUCH MUCH HIGHER (many dB's) compared to when the Milky Way is at lower elevations or when it is no longer in the visible Sky. In other words, the precise timing of a QSO can make a tremendous difference on the outcome. Imagine for instance trying to make a QSO with a rare DX Expedition which is running a low ERP station, a few extra dB of noise is a big deal and an absolute game changer! Based on the graphs above, we are talking about a decrease of about 2dB of noise every hour as the Milky Way is descending!
The results above are extremely exciting to me and quite eye-opener. I recommend downloading the software developed by the late Doug McArthur VK3UM, who unfortunately passed away just a few days ago. Doug was a true legend and Pioneer in the field of EME. His software has great features which enables mapping out the various noise sources for different bands.
 PS: to the right, a picture of the Milky Way and Sagittarius-A as seen in the Northern Hemisphere
 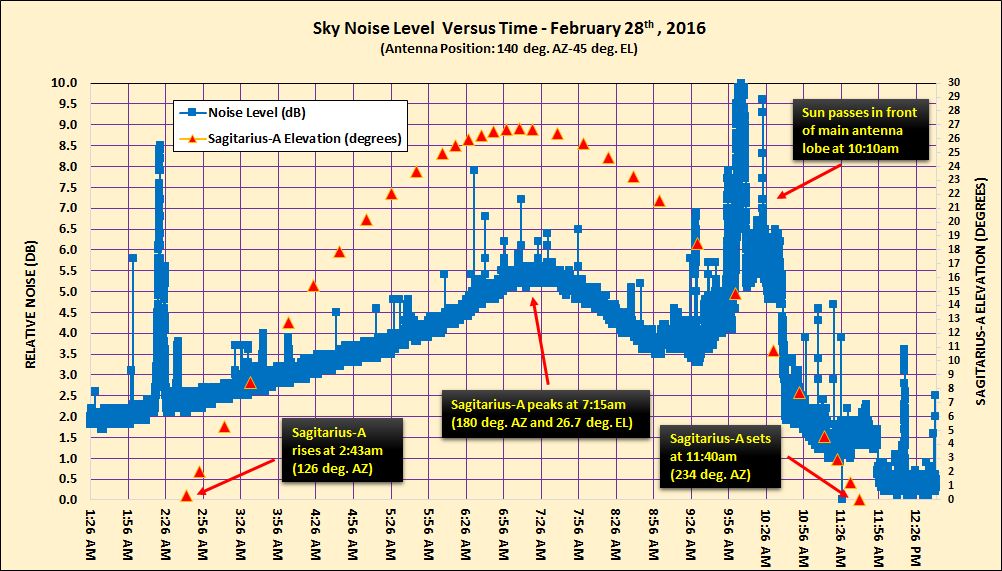 Before going further, let's explain a little bit how this plot is constructed. The data points in blue are the many tens of thousands of noise measurements over time expressed in dB. In the "measure" mode, WSJT takes a measurement every second and that is what is represented in the plot (3600 data points every hour). The vertical axis to the left shows the relative noise scale in dB. The X-axis at the bottom represents the time when the data was collected. I will explain the rest of the graph a bit later...
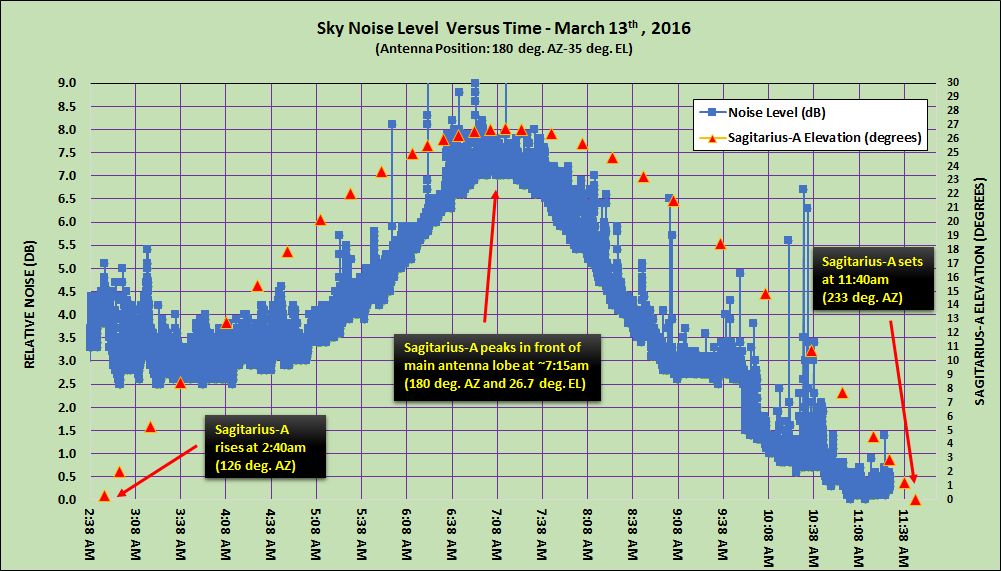 The puzzling and very interesting initial results prompted me to experiment further in the following days. This time, I purposely positioned the antennas in the direction closer to where Sagittarius-A would be "peaking", which is around 180AZ and 27EL. Since there are physical limitations elevation-wise in my backyard, I chose to position the antenna array at 180AZ and 35EL, which was close enough to the target.